Recent Posts

Thursday 24 October 2013

SCCM Forest Discovery Method

In this Post we will talk about a new Feature that was not there in SCCM 2007 . It is ” SCCM Forest Discovery Method” . Let us assume that you are being asked to Implement SCCM 2007 in an environment where you have two forests , then since there is no in place method , you might need to do some extra work . However , with Active directory forest discovery method being introduced in SCCM 2012 , all you have to do is to Enable the SCCM Forest Discovery method and you are done . The System Center Configuration Manager Forest Discovery method can help you identify as many forests as you can . So , now you can have just one SCCM Server and Manage Multiple Forests ( Subject to other conditions being true) . Let us have a look at the below figure :

SCCM Forest Discovery method


Monday 14 October 2013

GFI Languard and SCCM

Today in this post we will have a look at the software product Named GFI Languard . GFI Languard is a product of GFI and can be used for Patch Management , Vulnerability Assessment , Patch Management of Third party Applications Like Adobe , Tracking of Server Vulnerability and Network Vulnerability . Although GFI claims that the tool can be used for Patch Management ( Which it surely can do ) , but there are better products in the market for Patch Management ( Like SCCM ) .
GFI Languard GFI Languard
One Area where I think GFI Languard can be used is to track Vulnerabilities and close them using Better Patch Management tools like SCCM . GFI provides you a very handsome console where you can check for Vulnerabilities basis Server , Networks . It lets you scan your Network basis a number of criterion like Ip Range , Single Ip Address , Domain wise . GFI has a handsome reporting feature which can be used to make sure that your network is secure .

gfi-languard-2012

The Above figure shows a typical GFI Languard Dashboard where it shows you the Missing Patches and Vulnerability Classification .

Project Management Formats Download

Risk_Management_Strategy[1]

Risk_Register[1]


As a project Manager it is very important that you have a Risk Management Strategy and Maintain and keep updating the Risk Register . You may download the sample formats of Risk Register and Risk Management Strategy above ( Use links) .

[caption id="attachment_1007" align="alignnone" width="207"]Risk Register in Projects Risk Register in Projects[/caption]

Prince 2 Processes and Activities

Had a good document on PRINCE 2 processes and Activities . Hope this is of some help


Prince 2 Project Plan


Sunday 13 October 2013

Distribution Manager failed to install distribution point

Many a times , when we Install Distribution Point , we find out the the Distribution Point is not successfully Installed . After looking at the log files you find the below line in it :
" Distribution Manager failed to install distribution point "

Now , the issue would be due to a number of things . Let us start to troubleshoot it from the start . You first step is to have a look at the distmgr.log file . Below is the snapshot of the distmgr.log file .

Distribution Point Installtion Error 1

The screenshot clearly states that Dp files have not been installed . Now if you check the asset Message , you will see the below error :

Distribution Point Installtion Error

It says that "Distribution Manager failed to install distribution point" . If we can try and drill down further go to the Application Log onto the server and you will see something like the below ( atleast in my case , this may vary )  :

Distribution Point Installtion Error 2

As you may see that the application log gives us a more specific error as to User Rights . It is normally a good practice that you add the account that is being used for Distribution Point Installation on to the Local Admin group on the Distribution Machine . This would solve the issue for you in this case .  

However , If this does not solve the issue and you are creating the Distribution Point on a windows 7 Machine , check for the below things :

IIS 6 WMI compatibility Feature
IIS 6 Management compatibility feature

Technet also , gives its specification/ pre Requisites for Distribution Point Installtion :

You can use the default IIS configuration, or a custom configuration.

To use a custom IIS configuration, you must enable the following options for IIS:

  • Application Development: 

    • ISAPI Extensions


  • Security: 

    • Windows Authentication


  • IIS 6 Management Compatibility: 

    • IIS 6 Metabase Compatibility

    • IIS 6 WMI Compatibility


When you use a custom IIS configuration, you can remove options that are not required, such as the following:

  • Common HTTP Features:IIS Management Scripts and Tools

    • HTTP Redirection


Saturday 12 October 2013

Testimonials

its nice to see that blog found lot of good information
and do u have any trouble shooting documents on cm12 as u said in ur profile , so if possible to share , pls share.


By : kalyan chakravarthid

Thursday 10 October 2013

Progressive Elaboration - Project management

As we all know that Projects , Start as a concept and idea and over a period of time it develops into a Product or a service . This means that project develops in steps and continues by increments . Most of the time you see that requirements are not clear to you in the beginning and they become crystal clear with the passage of time . It is the characteristic of any project and the project management team has to live with it. But, how we can proceed? What is the approach to planning? This is where the concept of Progressive Elaboration comes in handy .

So , most of the times you start the project Confused and seem to get clarity with the passage of time .

Confused images


So you start of a little confused and become more comfortable gradually .The power of Progressive Elaboration .

 A below chart will make things more clear about Progressive Elaboration .

Progresssive Elaboration Process


Adding new Incident Category in SCSM - In Depth

Well !! In this Post we will talk about adding new Incident Category in SCSM  . It May be noted that Incident Management / Category is a default Category in SCSM and Cannot be Deleted . In this exercise we will see step by step as to how to create a new Incident category in SCSM .

Log into the server as Administrator :

Go to Service Manager > Library > Lists > Incident Classification :

System Center Service Manager Incident Category 1

Double Click the Incident Classification Link .

System Center Service Manager Incident Category 2


After that , Click on add Item and add a new Item As Operating System Issue . After that Add new Child Item under this as Blue Screen etc . Click ok  You will now see that all the items and sub items have been updated in the Incident Classification .

System Center Service Manager Incident Category 3


Now we are done on the server part . In order to confirm that these items have been visible to users as well . Let us log into a user system and see the user console as below :

System Center Service Manager Incident Category 4


Click on create request and you will see a window like this :

System Center Service Manager Incident Category 4


Click next and you will see that the new items have been added in the Incident box :

System Center Service Manager Incident Category 5


That's it !!


Halo Effect - Project Management

I have seen a lot of times in my career and have also learned from the experiences shared by others that a Senior member of the team who is Technically very sound is being made the project Manager for an up coming project . Reasons given mostly are :
1. The person has fdeep knowledge of the project 

2. The person is very good technically.

3. The person is working in the same time for a long period now and needs to be elevated .

4. The client is very happy with his work .

Image Ha

This is the biggest mistakes Organizations make . Rather than judging the project managemen capabilities of the person XYZ , they elevate a person to a Project Manager basis other factors which leads to a FAILURE .

 
This is called as HALO EFFECT .

Hope next time you need to take such decision you will remember me and the HALO effect :-)

Websense Working

How does Websense Work and What is Websense ?


In this Post we will talk about Websense Server and Its Working . As we all know that websense Filtering is used for Filtering Websites , Contents , Files , Downloads etc from the Internet . Today , Almost all the companies use Websense or some other product of its Category to Filter Web Traffic . The tools become all the more handy to provide different kind of Inter Access Rights to a different set of users .


Let us consider an Example , Let us say that your organization has 200 Users . 10 Users are from HR Department . Now , as a System Admin you are being asked to set up the system in such a way that only HR users can have access to Job Portals and No other user can access and Job portal . This is where Websense as a Tool becomes handy . You can use Websense Filtering Categories to create rules so that only HR people can access Job Portals .


With Websense you may also pull reports and see which user has accessed blocked websites , you can create Email alerts when a specific users uses a specific website n number of times .


Now to explain how does Websense Work , Have a look at the Diagram below . Fig 1 :

Websense Working


Your Local Websense Server is Connected to the Enterprise Websense Server and it gets live feeds from the Enterprise server to keep it self updated with the changes that have been made at the External Websense Centralized server . Your Users when they access Internet , All their requests pass through Websense and websense through its filtering criteria checks if this particular user has access to this website or not . Basis this you are allowed to access the website .


Wednesday 9 October 2013

Queries over Email

I have been getting a lot of queries over Email from the readers . I would appreciate if you can post your queries directly on the blog . This would help me a lot as my Mailbox is almost full :-)


Thanks in advance 

SCORCH Fundamentals - Detailed

The Post has been taken from Pete Zerger's Post :

The Building Blocks of a Runbook

SCOrch automation capabilities are based on the concept of runbooks (sometimes referred to as workflows…more on this later) which are visual representations of your data center processes as they are automated in SCOrch. You create runbooks by dragging and dropping activities into a workspace in the Runbook Designer (the primary administration and authoring interface of SCOrch) and connecting them with links. Each activity performs a specific action when it is executed (the precise behavior depending on how the activity is configured by the runbook author). Once an activity has completed it will output one or more data elements and trigger any activities that are linked to it. For example, the runbook in Figure 1 contains an activity that monitors a folder. When a file enters the folder, the activity triggers a second activity to move the file to an archive directory (here’s a very basic backup approach!), which in turn links an activity to log an event.

Image

Figure 1 – Sample Runbook

Links

Links connect activities in a runbook directing the flow of activity and data within a runbook based on conditions encountered at runtime. Whenever you create a link in a runbook, by default it is configured to trigger the next activity in the runbook when the previous one succeeds. However, links also provide filtering; this allows you to limit the data arriving at the following activity in the runbook and control the flow of runbook execution based on the result of activity execution. Link conditions provide a set of author-configurable functions for creating complex decision logic involving text, numeric or time-related data. Links configured with conditional filtering logic as described here are called Conditional Links. Configuring runbooks with multiple branches driven by conditional links is a concept calledbranching. To make your runbooks visually more intuitive, you can also change the display name of activities and link labels to make them more descriptive of their purpose in the runbook. You can also change link color to highlight success and failure branches within your runbooks.

For example, look at the runbook depicted in Figure 2, where the link labeled “Service Running” is configured to trigger the next activity in the runbook only if the Get Service Status activity returns a Service Status of ‘running’ (as pictured in the link properties in Figure 3).

Image

Figure 2- Sample runbook implementing conditional links and branching

Conditional Filtering in Links

You can configure conditional filtering in link properties, using both include and exclude logic. The Include tab specifies the conditions that will allow data to flow to the next activity in the runbook. The Exclude tab specifies the conditions that will cause data to be excluded from the next activity in the runbook.

Image

Figure 3 – Link properties of ‘Service Running’ link from runbook in Figure 2
Note: When implementing conditional filtering, bear in mind that rules on the Exclude tab always supersede the rules on the Include tab.

Activities, Integration Packs and Runbook Types

SCOrch comes with several dozen product-agnostic activities that perform a variety of functions; these are known as Standard Activities. To expand and customize the functionality of SCOrch, you can add additional product-specific activities, contained in packages known as integration packs (IPs). There currently exist System Center IPs with product-specific activities available for each member product in the System Center suite, as well as many third party applications, including several network monitoring platforms and service desk products. You can register and deploy integration packs using the Deployment Manager interface. You can even download community-developed integration packs and runbook samples from codeplex.com or the TechNet Gallery.

SCOrch runbooks will fall into one of two categories based on the first activities in the runbook:

  • An ad hoc runbook is a runbook started on demand by a runbook operator, author or from another runbook as needed. An ad hoc runbook will run once, perform the tasks it is configured to complete, and terminate.

  • monitor runbook runs automatically or on a schedule, waiting for a specific condition to trigger further action. You can usually tell the difference between the two because a monitor runbook will begin with an activities that has ‘monitor’ in the name. For example, the runbook shown in Figure 1 is a monitor runbook, which runs perpetually.


TIP: Monitor type activities must always be the first activity in the runbook. Monitor activities are triggered by the condition they are monitoring for, not by another activity.

——————————————————————–

Runbooks and Workflows…is there a difference?

You will often here the terms runbook and workflow used interchangeably. A workflow is unofficially and (very) loosely defined as an automation sequence involving multiple (nested) runbooks. More on this in “Advanced Runbook Features and Functionality,” in Part 2 of this series.

——————————————————————–

Data Publishing and the “Rules of the Data Bus”

SCOrch features a publish-and-subscribe data bus, which is the mechanism used within SCOrch to pass information from one activity in a runbook to the next activity. The data flowing along the path of the runbook is called published data, and each subsequent activity in the runbook adds its own data to the data bus. As the runbook progresses, more data becomes available. The published data capability of SCOrch is automatic and not configurable. Figure 4 illustrates runbook execution and data publishing.

Image

Figure 4 – Runbook execution and data publishing (concept)

The data collected or created by an activity is automatically published to the SCOrch data bus. As later activities execute, they can draw information from one or more previous activities. The runbook author can subscribe to this published data and use it in the configuration of activities within the runbook. For example, in the example runbook shown in Figure 4, the Query Web Service activity retrieves a SOAP message from a .Net web service, which is published to the data. The Query XML activity is configured to subscribe to this SOAP message and perform a query to retrieve a specific piece of data within the message. Finally, the Write Results to SQL activity is configured to subscribe to the XML query result and then write it to the database.

Every runbook runs within its own windows process (PolicyModule.exe – shown in Figure 4) and the data bus exists within this process. When the runbook completes execution, the data published to the data bus is lost. The number of data elements produced by an activity, as well as the configuration of the activity properties can affect how many times an activity executes and how many data elements are in the activity output. Here are some rules of the data bus that describe activity execution behavior in SCOrch:

Single Execution:  An activity will run one time for each time the previous activity runs.

Multi-Value Data:  An activity will run one time for each data item generated by the previous activity. For example, if you a Read Line activity that retrieves five lines of text, the next activity in the runbook will execute five times as well. If the next activity in the runbook were a Send Event Log Message, five events would be logged to the Application Event Log (each with one line of data if the activity is configured to subscribe to the line text output of the Read Line activity).

Flatten:  When you select the Flatten option, a multi-value data set will be consolidated to a single array with data items separated by the delimiter of your choice. The activity that follows will run only one time. This is handy when you want to write a multi-value data set to a single Windows event or database record. For example, if you a Read Line activity that retrieves five  lines of text and you check the Flatten checkbox, the next activity in the runbook will only execute once,  so only one  event would be logged to the Application Event Log ( data if the activity is configured to subscribe to the line text output of the Read Line activity).

Multiple Executions: You can configure Looping on an activity and enable multiple execution attempts. The Flatten option mentioned earlier does not affect an activity configured to execute multiple times. In short, when Looping is enabled on an activity and configured to exit only after five attempts, the activity will run the requested number of times whether Flatten is selected or not. Figure 5 shows an example of Looping configured to allow multiple execution attempts.

Image

Figure 5 – Looping configuration on a Read Line activity

Which Processes Should I Automate?

A common question often heard when talking to customers and partners is “Which processes should I automate? Where should I start?

You could start by asking yourself a few of the more obvious questions:


  • Which processes are the most time-consuming?


  • Where are service levels suffering the most?


  • Which problems recur most frequently? Which are most expensive for the company?


  • Which process failures are visible to customers?


However, processes do not have to be inherently time consuming, complicated or expensive for SCOrch to deliver benefits. The fact of the matter is that any predictable or repetitive task a human can perform SCOrch can perform just as well, with greater consistency, speed, logging, and integration with change management processes. In addition, every process automated saves money and time, freeing administrators up for other tasks.

SCOrch - A brief Introduction

This is my first  post on the wonderful tool by Microsoft called as SCOrch / System Center Orchestrator.

SCORCH

SCOrch is a tool which is primarily used for Process Automation . It is also called as ITPA ( IT process Automation Tool ) or RBA ( Runbook Automation ) . It has the the ability to define, build, orchestrate, manage and report on runbooks that support system and network operational processes.  The major benefit of the tool is that it can take away a lot of Programming efforts from your side and automate taks using its rules and runbooks . 

Well Does that mean I can automate stuff ( Which Otherwise I would have done using Scripting languages like PowerShell / Vb Script ) . 

True , yes you can .

 RBA using SCOrch can cross multiple IT management disciplines in a single automation sequence, integrating multiple IT management tools and interacting with all types of infrastructure elements to automate processes ranging from simple to complex, such as automating resolution of a known error or provisioning a new server and installing the necessary applications. 


Tuesday 8 October 2013

SCCM User Discovery - An In depth Insight

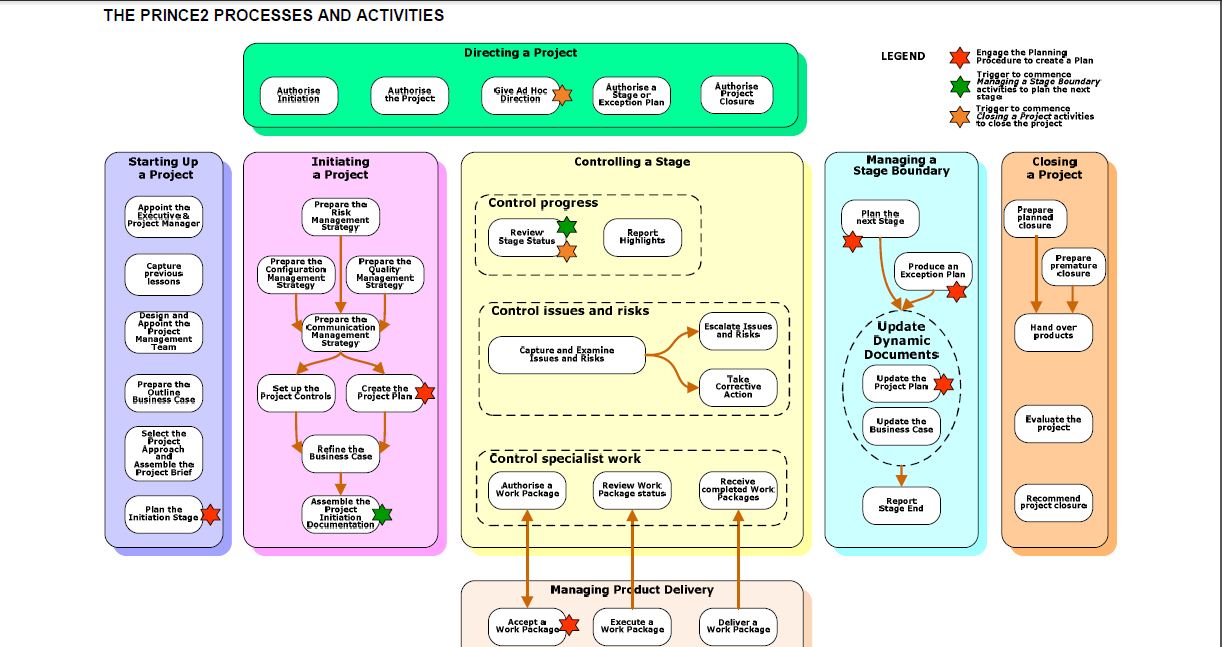
As we All Know that SCCM has Various Methods of Discovering Users , systems , Groups , Forest ( Something new in SCCM 2012 ) . Today we will take up SCCM User Discovery .

An In depth Insight :

___________________________________________________________________________________________

Let us have a look at the SCCM User Collections . Clearly in Fig 1 , we can see that there is No user in the User Collection .

Image

At the same time if we have a look at the logs Folder , We may see that there is No log which corresponds to User Discovery in SCCM . Fig 2 

Image

As we move onto the Discovery Methods we find out that User Discovery has been Disabled in SCCM . Fig 3 

Image

Now , Just Double Click the User Discovery Method and Enable it , Giving the Proper Container for it as shown in Fig 4 and Fig 5

Image

Image


Once this is done Click on Ok. 

Right Click on the User Discovery and Click Run Full Discovery . Fig 6

Image


Click yes .

Now , Go to the Logs folder and you will see Adusrdis log being shown up there . Fig 7

Image


Now , Open this log with the help of CM Trace Tool ( In case you have not installed it , Go to the   SCCM Install Directory > Tools > CMTrace ) . The very First thing that you  will see is User Discovery Component Setting was set to Active in the SCCM Control File . This is very Important thing to note . For any discovery to work it has to be active in the Control file . Fig 8

 Image

Once you see this , SCCM keeps on discovering Users and keeps creating DDR's for them . Fig 9 and Fig 10 

Image

Image

Finally , You can see the user Information being populated in the SCCM  Console :

Image

SCCM Job Opening

Those who are looking to change job in SCCM may send resumes to sccmabheek@gmail.com

Application Monitoring Using SCOM

Well !! Time to Move on to SCOM . This is my first Post on SCOM and it is primarily Taken up from ADAm Hall's Post :

Manager 2012 – the complete application monitoring solution


For many years Operations Manager has delivered infrastructure monitoring, providing a strong foundation on which we can build to deliver application performance monitoring. It is important to understand that in order to provide the application level performance monitoring, we must first have a solid infrastructure monitoring solution in place. After all, if an application is having a performance issue, we must first establish if the issue is due to an underlying platform problem, or within the application itself.

A key value that Operations Manager 2012 delivers is a solution that uses the same tools to monitor with visibility across infrastructure AND applications.

To deliver application performance monitoring, we provide 4 key capabilities in Operations Manager 2012:

  • Infrastructure monitoring – network, hardware and operating system

  • Server-side application monitoring – monitoring the actual code that is executed and delivered by the application

  • Client-side application monitoring – end-user experiences related to page load times, server and network latency, and client-side scripting exceptions

  • Synthetic transaction – pre-recorded testing paths through the application that highlight availability, response times, and unexpected responses


Configuring application performance monitoring


So it must be hard to configure all this right? Lots of things to know, application domain knowledge, settings, configurations? Rest assured, this is not the case! We make it incredibly easy to enable application performance monitoring!

It’s as easy as 1 – 2 – 3 …

1. Define the application to monitor.

image

2. Configure server-side monitoring to be enabled and set your performance thresholds

image

3.  Configure client-side monitoring to be enabled and set your performance thresholds

image

And that’s it, you’re now set to go. Of course setting the threshold levels is the most important part of this, and that is the one thing we can’t do for you… you know your application and what the acceptable performance level is.

Configuring an application performance dashboard in 4 steps


It’s great that we make the configuration of application performance monitoring so easy, but making that information available in a concise, impactful manner is just as important.

We have worked hard to make the creation of dashboards incredibly easy, with a wizard driven experience. You can create an application level dashboard in just 4 steps:

1. Choose where to store the dashboard

image

2. Choose your layout structure. There are many different layouts available.

image

3. Specify which information you want to be part of your dashboard.

image

4. Choose who has access to the dashboard. As you will see a little later in this article, publishing information through web and SharePoint portals is very easy.

image

And just like that, you’ve created and published an application performance monitoring dashboard!

Open up the conversation


Anyone who has either worked in IT, or been the owner of an application knows the conversations and finger pointing that can go on when users complain about poor performance. Is it the hardware, the platform, a code issue or a network problem?

This is where the complete solution from Operations Manager 2012 really provides an incredible solution. It’s great that an application and associated resources are highly available, but availability does not equal performance. Indeed, an application can be highly available (the ‘5 nines’) but performing below required performance thresholds.

The diagram below shows an application dashboard that I created using the 4 steps above for a sample application. You can see that the application is available and ‘green’ across the board. But the end users are having performance issues. This is highlighted by the client side alerts about performance.

image

Deep Insight into application performance


Once you know that there is an issue, Operations Manager 2012 provides the ability to drill into the alert down to the code level to see exactly what is going on and where the issue is.

image

Reporting and trending analysis


An important aspect of application performance monitoring is to be able to see how your applications are performing over time, and to be able to quickly gain visibility into common issues and problematic components of the application.

In the report shown below, you can see that we can quickly see areas of the application we need to focus on, and also understand how these components are related to other parts of the application, and may be causing flow-on effects.

image

image

Easily make information available


With Operations Manager 2012, we have made it very easy to delegate and publish information across multiple content access solutions. Operations staff have access to the Operations Manager console, and we can now easily publish delegated information to the Silverlight based Operations web console and also to SharePoint webparts.

And best of all, the information looks exactly the same!

image 

Footer Widget 1

Contact Us

Page Views

Footer Widget 3

Entertainment

Technology

Footer Widget 2

Powered by Blogger.

Translate

Social Icons

Followers

Search This Blog

Featured Posts

Random Post


© 2013 Learn IT " The Easy Way " . All rights resevered. Designed by Templateism

Back To Top